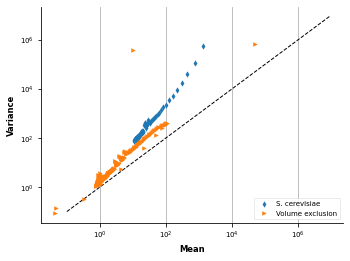
Are contact counts overdispered?
import os
import matplotlib
import matplotlib.pyplot as plt
import numpy as np
from pastis import dispersion
/usr/share/miniconda3/envs/pastisnb/lib/python3.9/site-packages/pastis/externals/iced/normalization/_ca_utils.py:8: UserWarning: The API of this module is likely to change. Use only for testing purposes
  warnings.warn(
/usr/share/miniconda3/envs/pastisnb/lib/python3.9/site-packages/iced/normalization/_ca_utils.py:8: UserWarning: The API of this module is likely to change. Use only for testing purposes
  warnings.warn(
/usr/share/miniconda3/envs/pastisnb/lib/python3.9/site-packages/pastis/fastio.py:7: UserWarning: The module pastis.fastio is deprecated. The packaged iced has identical features and should be used instead. This module will be removed in version 0.5
  warnings.warn(
from pastis import fastio
from iced import io
import iced

def load(filename, normalize=True, bias=None):
    try:
        lengths = io.load_lengths(filename.replace(".matrix", ".bed"))
    except IOError:
        lengths = io.load_lengths(filename.replace(".matrix", "_abs.bed"))

    counts = io.load_counts(filename, lengths=lengths)

    # Remove the diagonal and remove 0 from matrix
    counts.setdiag(0)
    counts = counts.tocsr()
    counts.eliminate_zeros()
    counts = counts.tocoo()

    perc_filter = {"/1mb": 0.01,
                   "/500kb": 0.02,
                   "/250kb": 0.03,
                   "/200kb": 0.04,
                   "/100kb": 0.05,
                   "10000.": 0.04,
                   "40000": 0.04,
                   "/50kb": 0.06}

    if normalize and bias is not None:
        bias = np.loadtxt(bias)

        # First, filter out loci that have a bias equal to nan.
        counts = counts.tocsr()
        counts = iced.filter._filter_csr(counts, np.isnan(bias))
        normed = counts.copy()
        # Second, normalize the remaining counts with the bias vector provided
        bias[np.isnan(bias)] = 1
        normed = iced.normalization._update_normalization_csr(
            normed,
            bias.flatten())
    elif normalize:
        print("Normalizing")
        for k, v in perc_filter.items():
            if k in filename:
                print("Filtering", v)

                sum_ax = counts.sum(axis=0).flatten() + \
                    counts.sum(axis=1).flatten()
                p = float((sum_ax == 0).sum()) / counts.shape[0]

                counts = iced.filter.filter_low_counts(
                    counts, percentage=(p + v),
                    sparsity=False)
                break
        counts = counts.tocsr()
        counts.eliminate_zeros()
        normed, bias = iced.normalization.ICE_normalization(
            counts, max_iter=300,
            output_bias=True)
    else:
        bias = None
        normed = counts

    counts.setdiag(0)
    counts = counts.tocsr()
    counts.eliminate_zeros()
    counts = counts.tocoo()
    normed.setdiag(0)
    normed = normed.tocsr()
    normed.eliminate_zeros()
    normed = normed.tocoo()
    if bias is not None:
        bias[np.isnan(bias)] = 1
        bias = bias.flatten()
    else:
        bias = np.ones(normed.shape[0])

    return counts, normed, lengths, bias
matplotlib.rcParams['xtick.direction'] = 'out'
matplotlib.rcParams['ytick.direction'] = 'out'
matplotlib.rcParams["axes.labelsize"] = "small"
matplotlib.rcParams["xtick.labelsize"] = "x-small"
matplotlib.rcParams["ytick.labelsize"] = "x-small"

markers = ["d", ">", ".", "8", "*"]
filenames = [#"../../../data/sexton2012/all_10000_raw.matrix",
             "./data/duan2009/duan.SC.10000.raw.matrix",
             "./data/scerevisiaeve2015/counts.matrix",
             ]

legends = [#"D. melanogaster",
           #"A. thaliana",
           #"H. sapiens",
           "S. cerevisiae",
           "Volume exclusion"]

widerange = np.exp(np.arange(np.log(1e-1), np.log(1e7), 0.01))
fig, ax = plt.subplots()
fig.subplots_adjust(left=0.2, top=0.95, bottom=0.2)
legend_markers = []
for i, filename in enumerate(filenames):
    normalize = True
    if "scerevisiaeve2015" in filename:
        normalize=False
    counts, normed, lengths, bias = load(
        filename, normalize=normalize)
    _, mean, var, _ = dispersion.compute_mean_variance(
        counts,
        lengths,
        bias=bias)
    if "rao" in filename:
        zorder = 5
    else:
        zorder = 10
    s = ax.scatter(mean, var, linewidth=0, marker=markers[i],
                   s=20, zorder=zorder)
    legend_markers.append(s)

ax.set_xscale("log")
ax.set_yscale("log")

le = ax.legend(legend_markers, legends, loc=4, fontsize="x-small")
ax.set_xlabel(r"Mean", fontsize="small", fontweight="bold")
ax.set_ylabel(r"Variance", fontsize="small", fontweight="bold")

ax.plot(np.arange(1e-1, 1e7, 1e6),
        np.arange(1e-1, 1e7, 1e6),
        linewidth=1,
        linestyle="--", color=(0, 0, 0))

ax.grid("off")
ax.spines['right'].set_color('none')
ax.spines['top'].set_color('none')
ax.xaxis.set_ticks_position('bottom')
ax.yaxis.set_ticks_position('left')

ax.grid(which="major", axis="y", linewidth=0.75, linestyle="-",
        color="0.7")
f = le.get_frame()
f.set_linewidth(0.5)
/usr/share/miniconda3/envs/pastisnb/lib/python3.9/site-packages/iced/io/_io_pandas.py:56: UserWarning: Attempting to guess whether counts are 0 or 1 based
  warnings.warn(
Normalizing
Filtering 0.04
/usr/share/miniconda3/envs/pastisnb/lib/python3.9/site-packages/scipy/sparse/_index.py:125: SparseEfficiencyWarning: Changing the sparsity structure of a csr_matrix is expensive. lil_matrix is more efficient.
  self._set_arrayXarray(i, j, x)